Tracking Greenhouse Gas Emissions with VelocityEHS Performance Metrics
10/12/2017
Introduction
A growing number of businesses all around the globe are committed to the goal of being more environmentally sustainable. In addition to reducing their impacts on the environment, sustainable companies are achieving significant financial advantages, including reduced regulatory risk, decreased costs, and an improved corporate reputation in the eyes of customers and investors alike.
As the debate over climate change heats up, one of the most commonly pursued areas of corporate sustainability is the reduction of the organization’s carbon footprint, and that means greenhouse gas (GHG) emissions. First, however, you need to be able to measure your GHG emissions so you can develop and evaluate effective strategies for reducing them.
Tracking greenhouse gas (GHG) emissions can be a laborious, time-consuming, and often frustrating process – and as the number of emissions sources and locations that you must monitor increases, the greater the challenge will be. The VelocityEHS Performance Metrics product simplifies this otherwise complex process, and gives you easy-to-use data collection, analysis, and reporting tools to help you gain a complete picture of your GHG emissions profile, and ultimately drive more sustainable business decisions.
Let's take a look at an example of how the VelocityEHS Performance Metrics solution can be set-up to help you administer a highly-effective GHG monitoring and reporting system.
The Problem
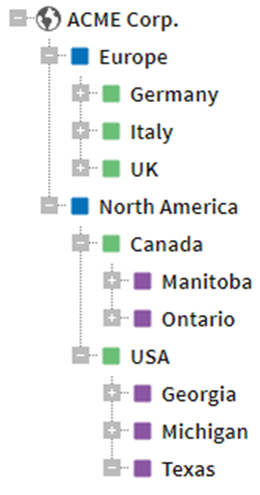
ACME Corp. is a manufacturing company whose product line includes various household and industrial mechanical devices, as well as a number of explosives. They're a global company, with factories in the US, Canada, and several European nations. Their location structure looks a little something like this:
ACME needs to comply with governmental Greenhouse Gas reporting requirements for some of their facilities. In addition, their shareholders have demanded that ACME participate in the Carbon Disclosure Project (CDP). Unfortunately, ACME Corp. has a negative reputation with some of the communities in which they operate, and the shareholders want to rehabilitate their corporate image. The shareholders think that showcasing the company's "green" initiatives will be a good start. The question, then, is how ACME can monitor and ultimately reduce their carbon footprint?
Tracking greenhouse gas contributions is easier said than done. Figuring out all the contributing factors to GHG emissions and keeping that list current is not an insignificant task by itself, and gathering high quality data – often from multiple time zones and from speakers of different languages – is a real challenge. Many organizations resort to quarterly or annual questionnaires, others employ a network of spreadsheets linked back to a master document, and others still will build a software system in-house. These solutions often require a lot of poking and prodding to get people to use them, and it can be impossible to verify the quality of the data when something looks off.
The Solution
VelocityEHS lets you define the information you need to track, assign data collection responsibilities, apply necessary conversions, and then aggregate the data for reporting and analysis. With a few clicks, your GHG monitoring requirements, including who needs to enter data, how often it should be entered and how that data fits into the bigger picture, can be entered into the system which will then do all the hard work for you.
It works like this:
Planning
ACME's Sustainability Manager sits down and determines two key items:
- What information they already track as a company, or can easily track
- What information they want to be able to calculate and report on.
The lists look something like this:

Setup
Input Metrics
The Sustainability Manager knows that each of their facilities uses electricity, provided by a local utility company. With their VelocityEHS Performance Metrics solution, the Sustainability Manager creates an input metric for Grid Electricity, and assigns it to each facility for data collection and input on a monthly basis:
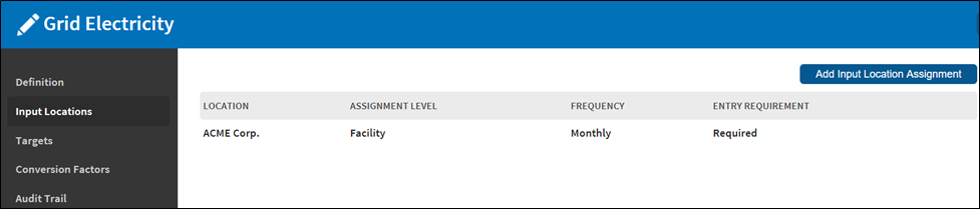
With this metric created and assigned, designated users from each facility will be able to go into the application each month and enter their own facility's electricity consumption values.
The Sustainability Manager also adds a plausibility review, to make sure the entered data is reasonable. As data is entered, it can be compared to previous entries at that location to see if it falls within a predefined range:
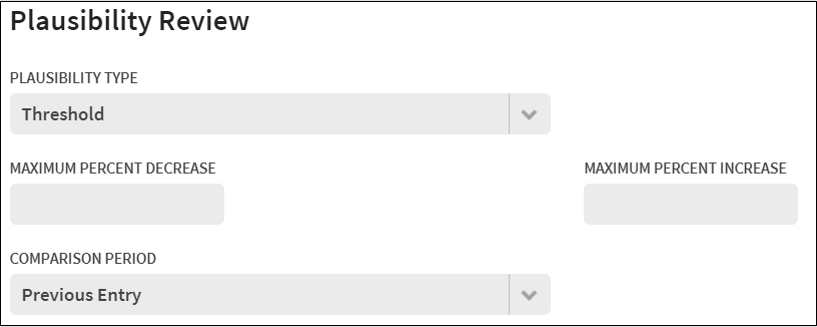
If the data being entered fails the plausibility review, the user is prompted to double check their entry and either correct it or provide an explanation for the variance. The plausibility review prompt, as well as the entire data collection form and all interface text, are translated into the user's own language.
However, Grid Electricity is not the only contributor to ACME’s GHG emissions. Each item in the "Tracking" list that the Sustainability Manger developed during the planning phase represents a different input metric. Each input metric (the data that ACME is already tracking) is also assigned for collection and entry (input) at the different locations, and at the frequency required by each location.
Once that data is entered, the VelocityEHS Performance Metrics solution can aggregate the data over time (e.g., a 12-month period) and across multiple locations (e.g., all of Europe or USA, or the entire company) for reporting purposes, and that’s just scratching the surface of what the Performance Metrics solution can do!
Conversion Metrics
While the data points on the "Tracking" list are categorized as input metrics, values in the "Report" list will become conversion metrics. Conversion metrics are not observed or measured data, but rather are obtained based on calculations and conversions of the selected input metrics.
There are a great number of emissions values and conversion factors published by various sources – such as the United States Environmental Protection Agency (US EPA), Environment and Climate Change Canada, the Intergovernmental Panel on Climate Change (IPCC), utility companies and equipment manufacturers — to help simplify the calculation of conversion metrics that would otherwise require complex chemical and physical analyses to quantify. However, it may be necessary to develop new or unique conversion factors depending on your data and reporting needs.
Calculating Conversion Metrics
Assigning Conversion Factors by Location
In ACME's case, for their Grid Electricity input metric they'll create conversion factors for each of their facilities (at the state/province level, or at the country level, depending what's available) in order to calculate what they want to report on: Carbon Dioxide Equivalents. (ACME will start off with a small effort, before looking to expand into more detailed reporting). They'll create conversion factors for each facility to correlate electricity consumption with emissions, and then repeat that process for the remaining input metrics:
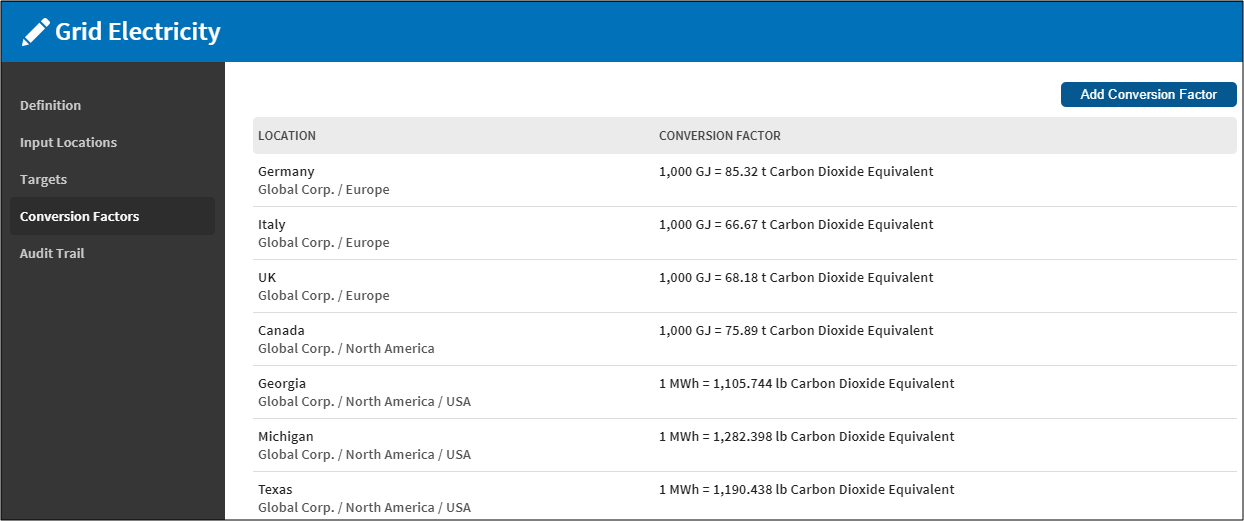
Figure 3: Conversion factors for Grid Electricity, showing resulting amounts of CO2e, by location
ACME's Sustainability Manager is only able to find data at the national level for Canada, but that's not a problem. The VelocityEHS Performance Metrics product automatically applies any conversion factor created at a higher location level down to individual sub-locations and facilities if they don't have their own overriding conversion factor. (The factors created for Canada would never be applied to the U.S. facilities, because those facilities are in a separate branch of the location tree.) The Sustainability Manager uses national data from the IPCC for ACME’s European facilities, and state-level data from the U.S. EPA for its facilities in the U.S.
Data Outputs
With the conversion factors created, any data entered for the Grid Electricity metric will have all conversion factors for that location (and time period) applied, and the desired conversion metric (Carbon Dioxide Equivalent) can be calculated. For example, entering 1000 GJ of electricity consumed at a facility in Canada results in two values that can be reported on:
- Electricity: 1000 GJ
- Carbon Dioxide Equivalent (CO2e): 75.89 t
Data can be entered in any unit necessary (e.g., MJ or kWh or MWh). Likewise, data can be output in any units desired (e.g., GJ or MMbtu, kg or t, lbs or tn, etc.). In all cases, when converting between units of the same type (in this case, either energy or mass), VelocityEHS will automatically apply the necessary unit conversions – including between metric and imperial measurements.
Data can now be reported for ACME's Carbon Dioxide Equivalent emissions.
Generating Reports
The Sustainability Manager has created the input metrics for the data they're currently tracking, as well as the conversion metric for Carbon Dioxide Equivalents that they want to calculate and report on. They've also identified and assigned the correct conversion factors for each of their input metrics in order to accurately calculate the conversion metric, and have assigned personnel at each of their facilities to enter the input data at the required intervals.
Normally, the next step for the Sustainability Manager would be to sift through the mountain of data in order to generate the necessary reports, but with the VelocityEHS Performance Metrics solution, now they can sit back and relax. The time-saving data visualization and reporting features of the Performance Metrics solution automatically aggregate all of the collected data, and pre-built reports can be quickly and easily configured to display exactly what they want to know in order to develop more effective GHG emissions reduction strategies.
For example, the Sustainability Manager can compare the carbon footprint (or the electricity usage) across locations:
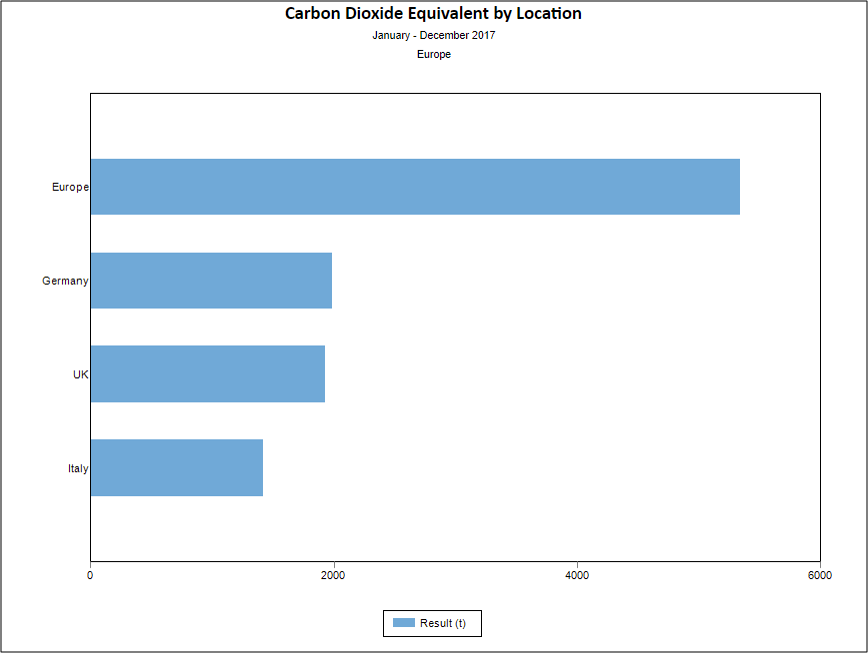
This provides a useful way to show stakeholders (company executives, external agencies, etc.) a snapshot of activity at one or more locations, and clearly communicate the information they're most interested in: "What were the total greenhouse gas emissions for this location?"
They can also review the carbon footprint GHG emissions over time:

They can even review individual entries to help evaluate potential contributing factors:
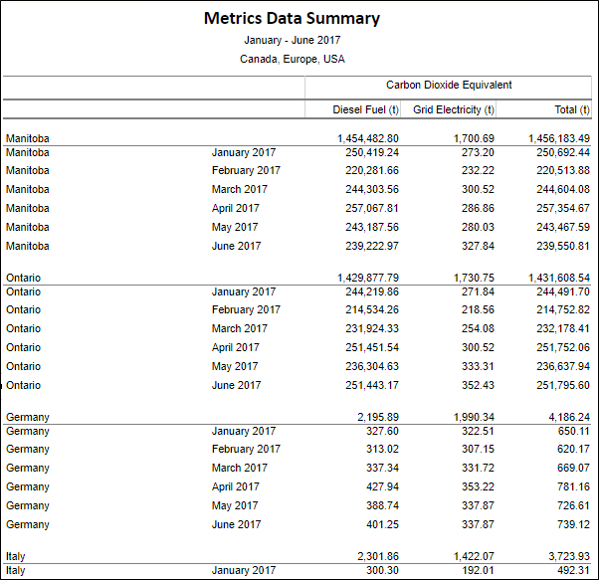
This summary table provides a convenient way to see how different input metrics – items being tracked such as Grid Electricity and Diesel Fuel – each contribute to ACME’s total Carbon Dioxide Equivalent emissions. Rather than comparing MWh and Joules of electricity to gallons and liters of diesel, stakeholders can see each item's contribution to emissions, measured in tons of CO2 Equivalent.
Outcomes
ACME Corp. needed to find a way to track the company's greenhouse gas emissions as part of a larger effort to improve sustainability throughout the organization. After the Sustainability Manager performed some initial planning to identify both the emissions data they already had access to and the information they wanted to report on, they used the VelocityEHS Performance Metrics solution to:
- Define the metrics to be captured (entered) and the metrics to be tracked and reported
- Ensure that the data would be recorded at the right locations, at the right frequency
- Define the conversion factors for the relationships between the data coming in and the data to be reported
- Produce reports for stakeholders showing snapshots of activity across locations and over time, and for themselves to monitor individual metrics' contributions to the company’s overall carbon footprint.
By leveraging the advanced capabilities of the VelocityEHS Performance Metrics solution, businesses can significantly reduce the time, effort and cost required to document compliance with GHG emissions monitoring and reporting requirements — while also receiving accurate, easy-to-interpret data to develop and implement targeted emissions reduction strategies that reduce your carbon footprint and improve sustainability.
Let VelocityEHS Help You!
As the saying goes, “You can't control what you can't measure.” If your company is looking to implement GHG reduction strategies, whether as part of compliance requirements or other corporate sustainability initiatives, you need an efficient system that helps you collect the right data, at the right place, and at the right time. However, reducing your emissions goes beyond just monitoring and measurement. You also need an easy way to analyze large volumes of complex emissions data, and quickly generate reports that help managers make timely and well-informed decisions about the sustainability of your organization.
The VelocityEHS Performance Metrics solution is designed to help businesses like yours more efficiently assign, collect and track a virtually limitless range of user-configurable EHS and sustainability metrics across your entire enterprise to ensure you get the data you need, right when you need it. Our powerful, yet easy-to-use calculation engine and analysis tools then allow you to clearly visualize and evaluate the success of your GHG reduction strategies.
To learn more about the VelocityEHS Performance Metrics solution and how we can help you improve the sustainability of your business, visit our website at www.EHS.com, or give us a call at 1.866.919.7922