The Dark Side of (EHS) Data
09/19/2014

At VelocityEHS, we care about presenting data in a way that clearly conveys the underlying message. Even so, it’s still rare to see data presented in a way that makes you say “Wow! That’s some great data visualization!” The reason may be because when you’ve seen great data visualization, you’re more focused on the data and the message that it’s conveying. The less you notice the presentation, the better it is.
On the other hand, it’s easy to point out bad examples of poor data visualizations. Sometimes problems are as straightforward as choosing the wrong chart type (pie charts, anyone). Sometimes it’s harder to pinpoint the difficulty, but you know it's there. Many infographics try hard to be visually appealing, and achieve this, but meaningful information can ends up becoming secondary to the aesthetics.
I like to nitpick and think of ways to improve data visualization. Here’s an example of a fairly simple infographic.
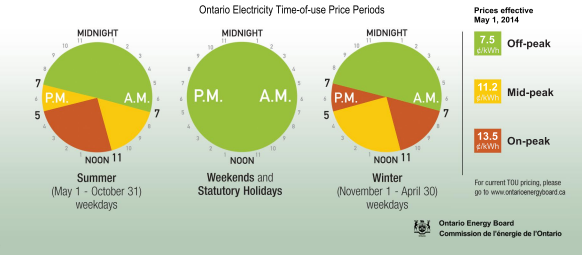
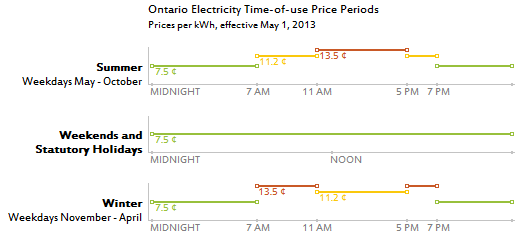
It’s the Ontario Energy Board’s description of electricity prices during different periods of the day at different times of the year (OEB website, infograph). I’ve seen it online and I’ve seen it on fridge magnets. The rates have even changed since I first saw it but the layout hasn’t changed. It’s not a terrible example of data visualization but I always wonder how it can be done better and so I decided to give it a try.
The first thing that bugs me is that the hours of the day are laid out in a circle. If I was going to put the hours of the day in a circle, I might lay them out with midnight at the bottom and noon at the top to match the path of the sun. That’s the opposite of what they’ve done. But my most intuitive thought is to lay out the hours the same way that you see them on an analog clock. That would mean that I would need to change each circle into a pair of circles, one for A.M. and one for P.M. That might work if there was only one circle to begin with but in this example I’d end up with six circles and I don’t think that’s worth exploring.
Another thing to point out is that the first thing the reader needs to see is the time of year. I’m writing this in September. I’m only concerned about the first two circles. I want to narrow down what I’m looking at right away but the time of year labels are currently at the bottom, which is the last place that my eyes are naturally going to go.
Given what I’ve said so far, here’s my first attempt at improving the infograph.
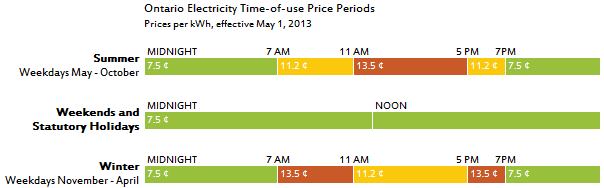
I find this to be pretty readable. You can start by picking out which bars you are interested in based on the time of year on the left and then continue to read naturally left-to-right from the beginning of the day until the end. In addition, the rates fit nicely within the bars so there is no need for a legend that your eyes might bounce to several times.
My last thought is that there is no visual comparison between the rates. The prices are listed but you have to do a little bit of math in your head to realize that the On-peak rate is not quite double the Off-peak rate or that the Mid-peak rate is a bit closer to the On-peak rate than it is to the Off-peak rate. Maybe we can do something to help that sink in a bit more quickly.
In my first change I got rid of the legend, but maybe something like a legend can help.
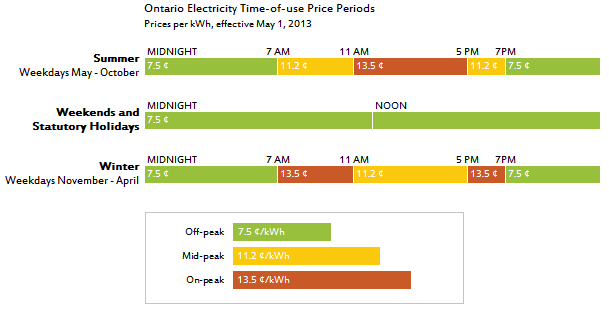
This new and improved legend gives you a pretty good sense of what the rates are like relative to the others. I am a bit concerned that the horizontal bars in the legend are fairly similar to the bars used in the rest of the graph. Maybe I shouldn’t use very similar bars that have different meanings in different places.
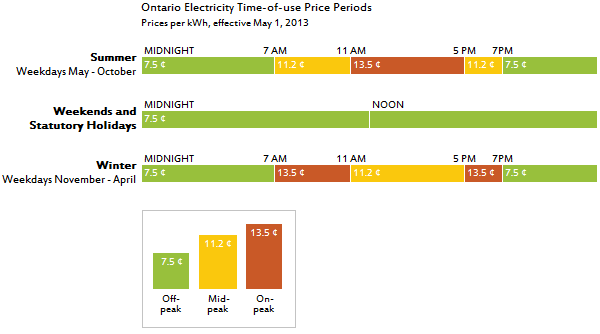
This has its pros and cons. I don’t have a preference between the two. Instead of trying to decide, I’m tempted to try to push things a little bit further. Maybe I can integrate the scale directly into the rest of the graph. What if I put a visual comparison of the rates directly into the graph?
I like this. There’s no need for your eyes to bounce around looking for more information. It’s all where it needs to be. There’s less dark ink, which I find to be pretty visually appealing. I also have the option of getting rid of the different colors since they don’t provide any extra information.
I’m sure I won’t get 100% agreement, but I’d love to see comments from anyone who disagrees. I’d also love to hear about any new ideas for additional improvements. There isn’t a simple formula that leads to great data visualization. It takes an open mind and some trial and error. You might never feel totally satisfied but it always feels nice to make improvements to how your data is communicated.